


note: Assuming Prometheus and Grafana are already operational on Instance A for monitoring, we'll now configure Node Exporter to collect disk space details from Instance B.
prerequisites: Open port 9100 on the instance where you intend to collect disk details (Instance B)
1. Login to the Instance from which you want to get the Disk space details from (Instance B)
2. Download latest node exporter using the following command (prometheus.io/download)
sudo wget https://github.com/prometheus/node_exporter/releases/download/v1.6.1/node_exporter-1.6.1.linux-amd64.tar.gz
3. Unzip the file
sudo tar xvfz node_exporter-1.6.1.linux-amd64.tar.gz
4. Move the node-exporter file from the folder to /usr/local/bin
sudo mv node_exporter-1.6.1.linux-amd64/node_exporter /usr/local/bin/
5. Create a new user node_exporter
sudo useradd -rs /bin/false node_exporter
6. Create a Systemd service for running node_exporter
sudo vim /etc/systemd/system/node_exporter.service
The above command opens up a service file, copy and paste the following config over there.
[Unit]
Description=Node Exporter
After=network.target
[Service]
User=node_exporter
Group=node_exporter
Type=simple
ExecStart=/usr/local/bin/node_exporter
[Install]
WantedBy=multi-user.target
7. Follow the below commands to start the systemd process
sudo systemctl daemon-reload
sudo systemctl enable node_exporter
sudo systemctl start node_exporter
sudo systemctl status node_exporter
note: Node-exporter runs on port 9100. Make sure the port is open for this instance.
Login to the Instance where Grafana & Prometheus is currently running (Instance A)
1. open the prometheus.yml
sudo nano /etc/prometheus/prometheus.yml
add a new
job_name: "node_exporter"under existing scrape configs and add youripaddress with port9100
global:
scrape_interval: 3s

scrape_configs:

# the space for other job's

   - job_name: "node_exporter"
     scrape_interval: 3s
     static configs:
         - targets: ["32.191.179.123:9100"]  # insert IP of Instance B here
2. follow the below commands for restarting the process
  sudo systemctl daemon-reload
  sudo systemctl restart prometheus
  sudo systemctl restart grafana-server
Setup alert using Grafana
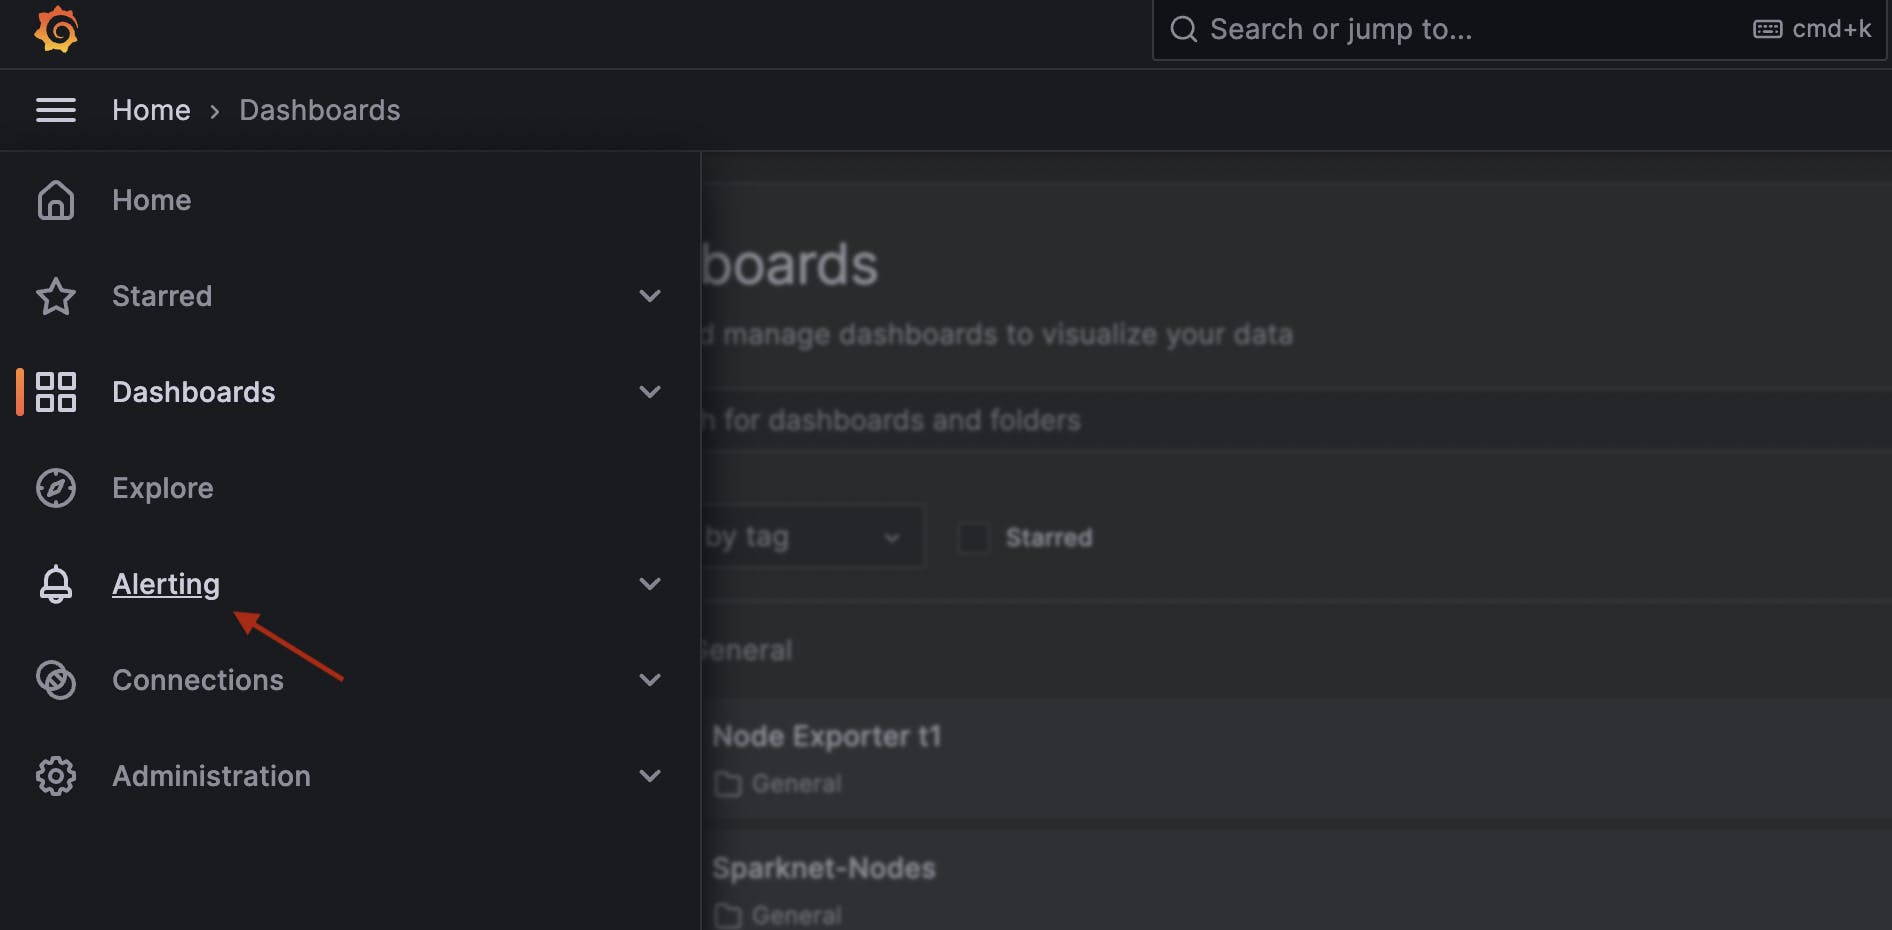
1. Login to your Grafana and Go to Alerting
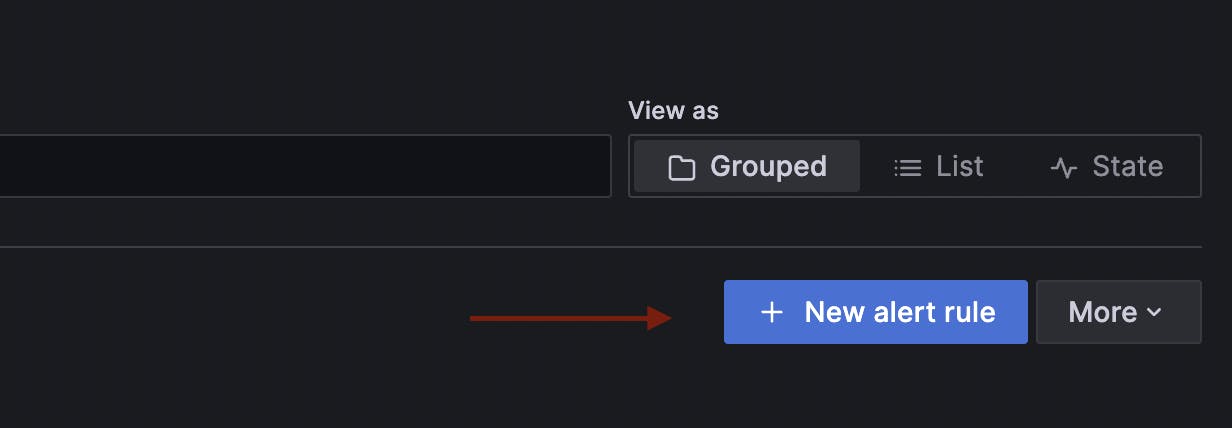
2. Click on Alert rules

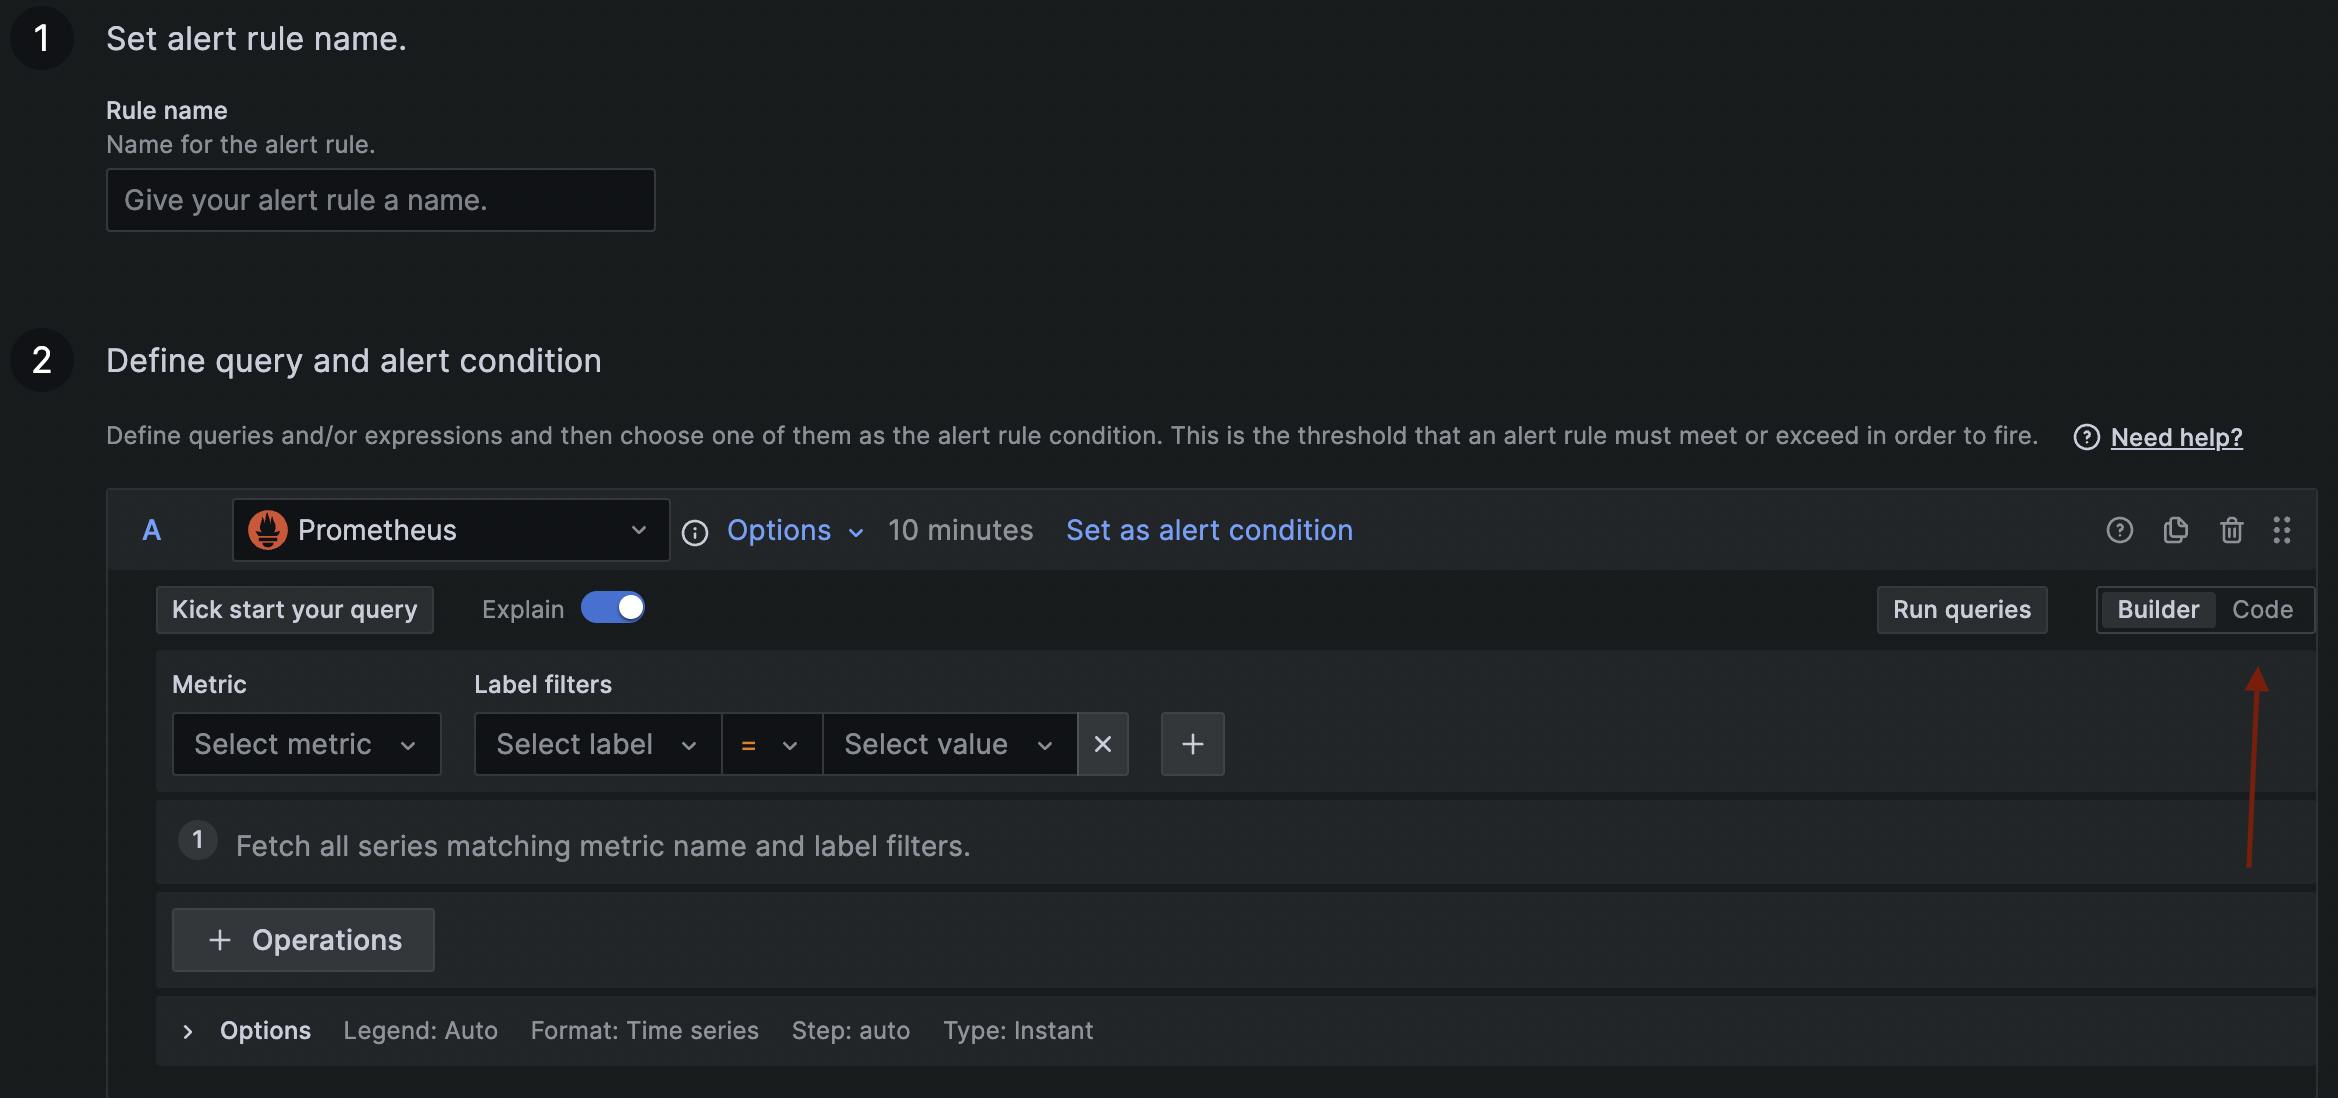
2. Add new Alert rule
3. Switch to Code in right corner
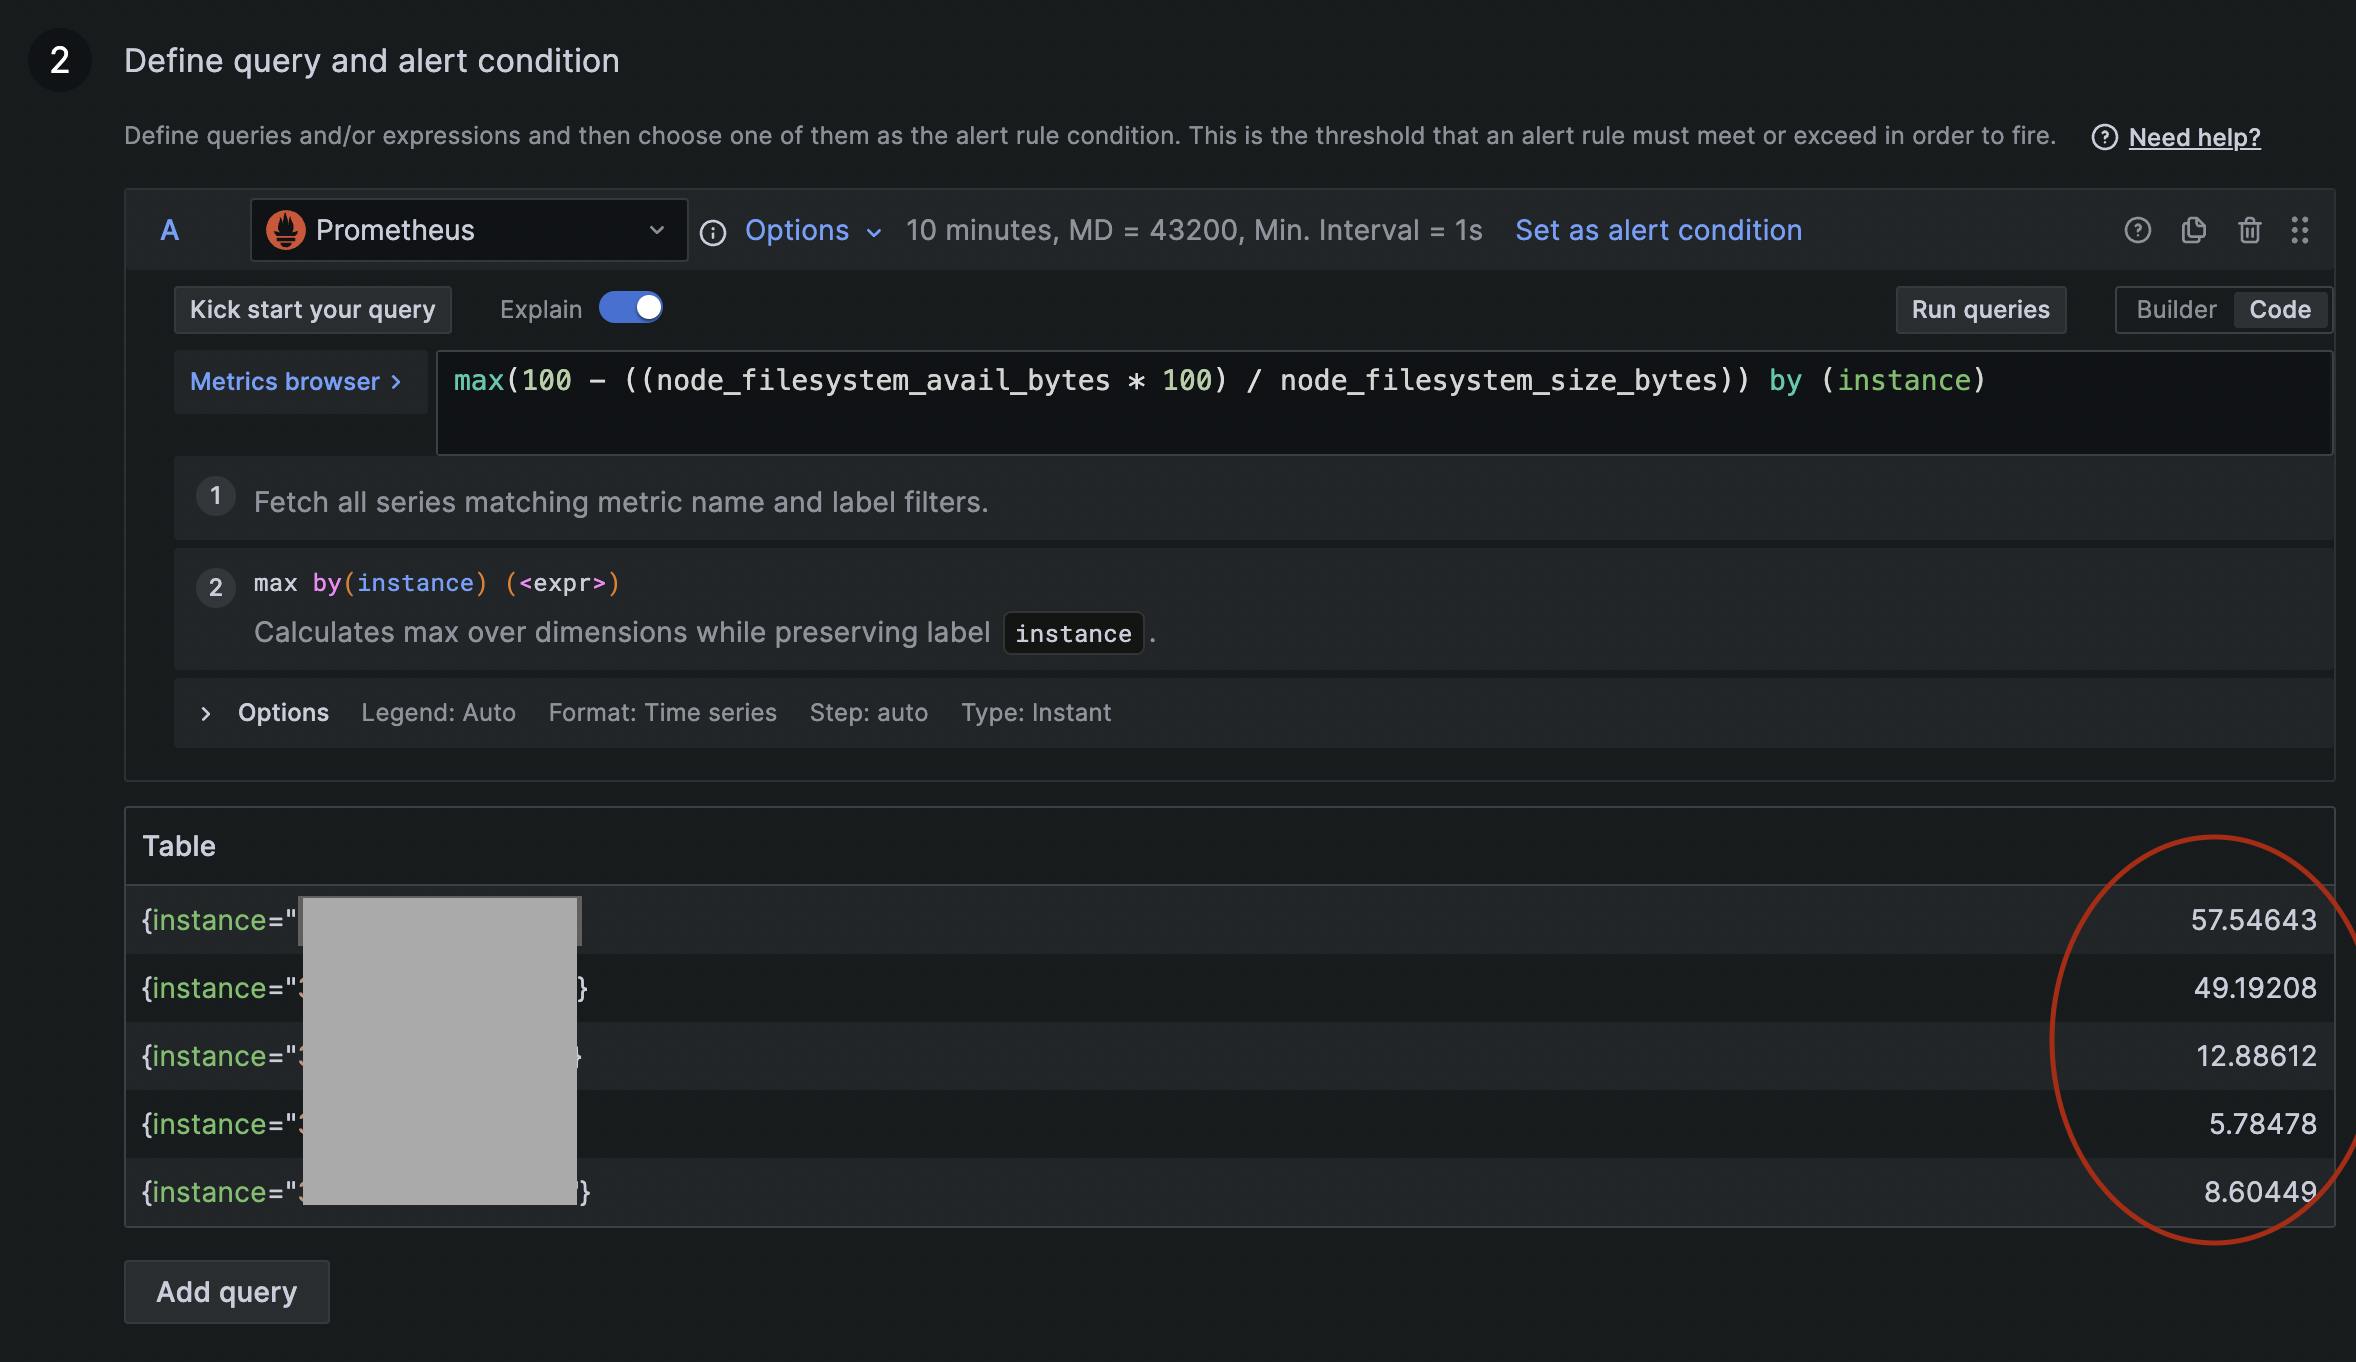
4. Run the following query
max(100 - ((node_filesystem_avail_bytes * 100) / node_filesystem_size_bytes)) by (instance)

5. The query returns the "Percentage of Disk Space" used up by the instance. In the following image you can see percentage of disk space used by 5 different instances.
6. Specify the threshold memory percentage at which you want to receive an alert.
